Showing posts with label baseball. Show all posts

Monday, November 13, 2023

A Look Back at Alex Gordon's Mad Dash Home That Never Was

Introduction

Apparently, I like doing sports forensic analysis. I must, since I'm clearly not doing it for the money. So here's a third installment, after my look at Derek Fisher's 0.4 shot and Mookie Betts's encounter with Houston's right field fans. This makes it two for three on forensic analyses done many many years after the fact, haha.

Let's set the stage: It's October 29, 2014. The San Francisco Giants and the Kansas City Royals are locked in a tightly contested winner-take-all Game 7 of the World Series. Both starting pitchers have long since been knocked out, and the Giants are clinging to a 3–2 lead in the bottom of the ninth. Giants ace pitcher Madison Bumgarner entered the game in the bottom of the fifth inning and hasn't left. He gave up a sharply rapped single to right to Omar Infante, then subsequently mowed down twelve straight batters.

Here, in the bottom of the ninth, he strikes out Eric Hosmer for the first out and gets Billy Butler to foul out weakly to first base for the second out. Bumgarner has now retired fourteen straight batters and needs just one more to record a five-inning save and earn the Giants their third title in five seasons.

But Alex Gordon, after fouling off the first pitch, cues a tailing liner into left center that dies just in front of the hard-charging center fielder Gregor Blanco, then bounces by him toward the wall in left center. He pulls up as it appears clear that left fielder Juan Pérez is going to beat him to the ball.

Pérez boots the ball as he rushes to pick it up, though, and a tense couple of seconds pass before he succeeds and finally gets the ball back to shortstop Brandon Crawford in shallow left. By the time he does so, Gordon is pulling into third base on a single plus two-base error, having gotten the stop sign from third base coach Mike Jirschele. Crawford checks to make sure that Gordon doesn't keep running, then throws routinely to first baseman Brandon Belt near the pitcher's mound.

Salvador Pérez (hereafter "Salvy," his nickname, to avoid confusion with Juan Pérez) now comes to bat, and there follow six specimens of what writer Wade Kapszukiewicz calls "Golden Pitches": pitches whose end result could potentially win the World Series for either team. Such pitches can only occur in the bottom of the ninth or any later inning of Game 7. If Salvy hits a home run, the Royals win the World Series. If he makes an out without first driving in Gordon, the Giants win the World Series.

Bumgarner goes to a tactic that has been successful all game for him: climbing the ladder on his high fastball and daring the Royals to hit it. Salvy swings repeatedly at pitches that are nearly neck high, and on the sixth pitch of the at-bat (and the 68th pitch of Bumgarner's appearance), he finally fouls out meekly to third baseman Pablo Sandoval, Gordon is stranded at third, and the Giants win.

In the aftermath of the game, and indeed all throughout the offseason, Jirschele and Royals manager Ned Yost were repeatedly asked whether they could have or should have sent Gordon home on that second-to-last play. Both were adamant that they made the right decision to hold Gordon, but the fact that Salvy never seemed to be able to contend on an equal footing against Bumgarner in this final at-bat sustained the fervent wish that Gordon had gone home.

But should he have? The question is a tantalizing one and touches on many notions of tactics and strategy. In this post, I'll analyze the game footage and other media and create a framework for deciding whether the Royals would have been better off sending Gordon home.

Technology and Stuff

The first order of business is to establish the basic facts of the play. How long after the crack of the bat did Gordon take to reach first base, second base, third base? When did Crawford field the throw from Pérez in left field? How far was he from home plate at that time? And how long would it take him to deliver the ball to catcher Buster Posey at home, if Gordon were to run home?

The play's timing can be determined by counting frames of the MLB video of the play and its various live-speed replays. Here's the play on YouTube; this video is encoded at 30 frames per second, so by counting frames from the initial contact with the bat and dividing by 30 frames per second, we can construct a timeline of the play:

  • 0.00 s: crack of bat
  • 2.97 s: ball falls in front of Blanco
  • 4.00 s: ball bounces a second time, then rolls to fence
  • 4.73 s: Gordon touches first base
  • 6.63 s: ball reaches the fence
  • 7.80 s: Pérez boots ball along fence
  • 8.43 s: Gordon touches second base
  • 10.00 s: Gordon turns to look at the play in the outfield (approx)
  • 10.17 s: Pérez throws ball to cutoff
  • 10.67 s: Jirschele begins raising his hands (approx)
  • 11.17 s: Jirschele's hands are now up to hold Gordon (approx)
  • 11.77 s: Crawford fields ball (about 212 feet from home plate)
  • 12.17 s: Gordon stops at third base
  • 13.53 s: Crawford throws to Belt
  • 14.93 s: Belt fields ball and time is called

For some of these events, I also used, as secondary event and time sources, this MLB Statcast video, this fan video from just above the Giants' dugout, and this other fan video from the left field stands, all encoded at 30 frames per second. None of these times are accurate to any better than 1/30 of a second, therefore, though they've been rounded to the nearest hundredth to simplify the arithmetic. I estimate these times have an error of about ±0.05 seconds.

Incidentally, ESPN also analyzed the MLB video, and somehow got 8.30 seconds for Gordon to touch second. I've measured it a few times, and I don't see how they get that. The rest of our times are within my ±0.05 second error bar, including notably the time it took for Gordon to reach third base, which makes that 0.13 second discrepancy even odder. I'll use my figure of 8.43 seconds, to keep the methodology consistent.

Next, how far was Crawford as he fielded the throw and prepared to throw home if necessary? For this analysis, as a reference frame for determining event locations, I used the special groundskeeping design for the World Series games at Kauffman Field in Kansas City, which is depicted here (click to enlarge):

Gorgeous setting, by the way. This photo is from before Game 1, but I don't think the pattern changed for Game 7. As you can see, left field (and right field, but we're focusing on left field) is criss-crossed with a lattice of intersecting light and dark bands, which will serve as a grid for us to identify the locations of players and events during the play. We'll need to fix this grid on a diagram of Kauffman Field, which we create from Google Maps's satellite view (click to enlarge):

North is up. This groundskeeping pattern is not the one from the 2014 World Series, so we can't simply use the satellite image as is. Rather, by comparing the two images, we create an overlay for the World Series groundskeeping pattern. I've rotated the image counter-clockwise by 2 degrees to line the field up horizontally and vertically, then added the relevant portion of the pattern as green outlines (click to enlarge):

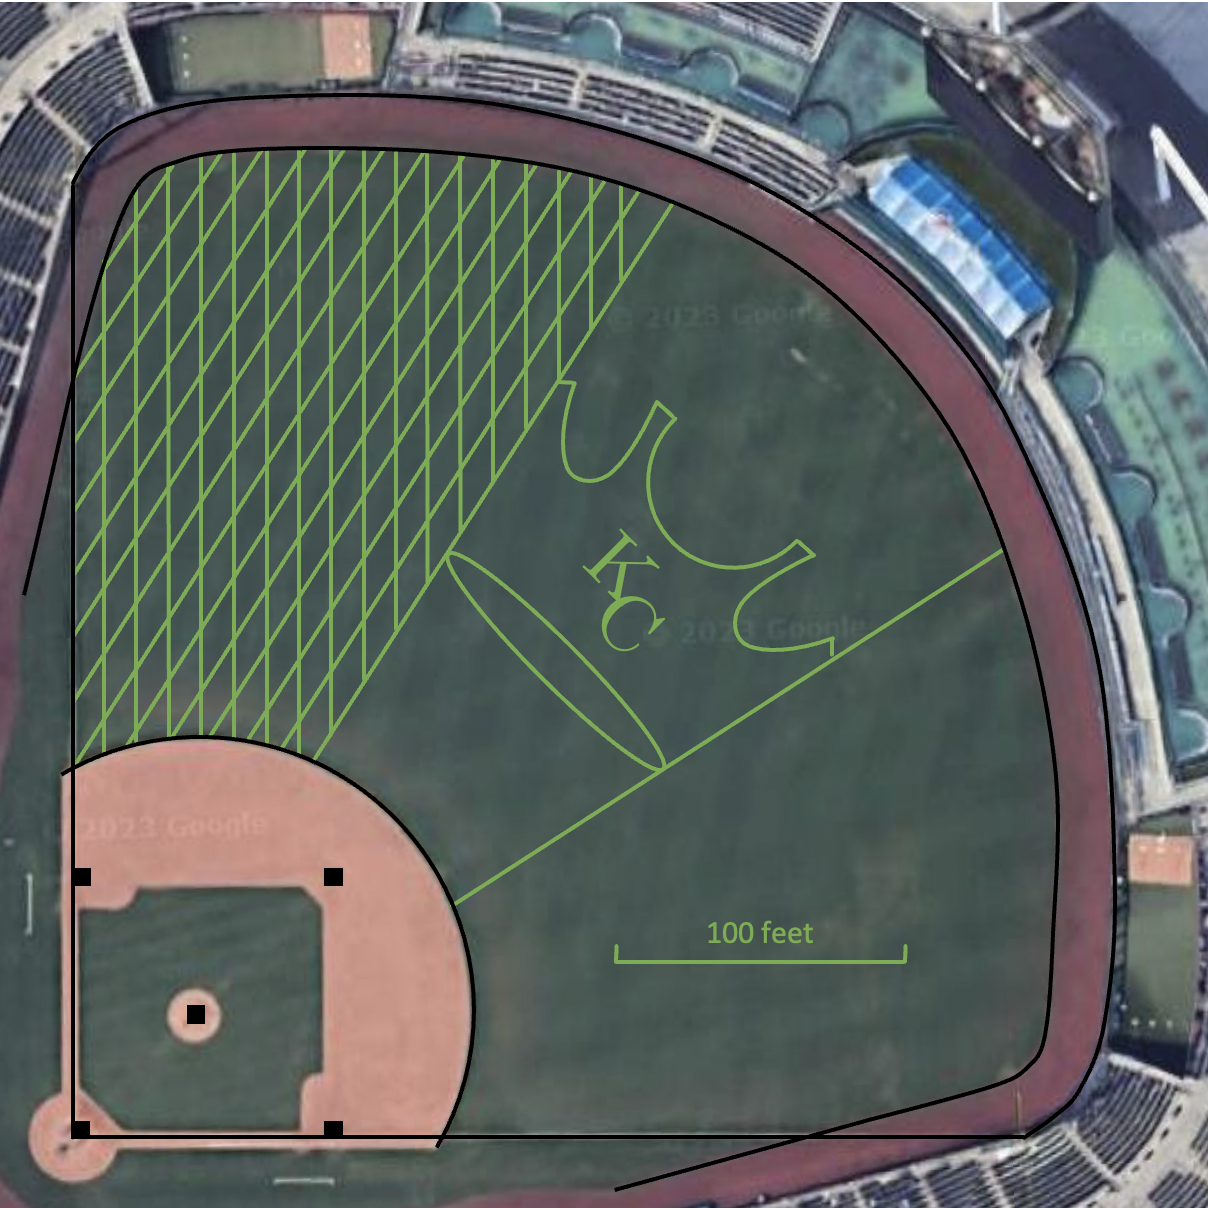
Now that we have the grid laid out, we dispense with the satellite view, go through the video, and place the various events on our overlay (click to enlarge):

These events include positions of Blanco (B1 and B2), Pérez (P1, P2, and P3), and Crawford (C1 and C2) throughout the play, as well as the path of the hit ball through the outfield (H1, H2, H3, and H4). We now remove the grid as well, and connect the main events (click to enlarge):

The throw that Crawford would have had to make is the dotted orange arrow to home. By measuring against the 100-foot scale, we see that the throw is about 212 feet. I estimate this method to have an error of maybe ±10 feet, so it's somewhere between 202 feet and 222 feet, but the rest of my analysis will assume a distance of 212 feet.

That's well outside most casual estimates. ESPN's article gauged it at 180 feet, which is 15 percent low. My first off-the-cuff estimate was 140 feet, which is on the skinned infield and ridiculously low, though it was echoed by multiple commentators; then, I guessed 180 feet, in line with ESPN's estimate. Crawford himself thought he was 30 to 40 feet out onto the outfield grass, which would put him 180 to 190 feet from home plate. The longer throw makes the potential play closer than otherwise—but is it close enough to send Gordon?

So Much Crawford

The critical factor is how long Crawford reasonably needs to turn that throw around to home plate. Fortunately, we have plays to compare this one to. The closest play I could find is from September 9, 2016, with the Arizona Diamondbacks hosting the Giants. In the bottom of the seventh inning, with the Giants leading 5–4, Chris Owings hits a fly ball to deep center that bounces off the glove of Denard Span. Socrates Brito scores easily from second base to tie the game, and Owings tries to come all the way around to score also, but he's nipped at the plate by a strong throw from Crawford. (The game went into extra innings tied at 5, and the Giants eventually won 7–6 in 12 innings, so the play turned out to be critical.) Again, we can create a timeline:

  • 0.00 s: crack of bat
  • 11.47 s: Crawford fields ball (about 235 feet from home plate)
  • 12.20 s: Crawford throws ball
  • 14.33 s: Posey fields ball
  • 14.80 s: Posey applies tag
  • 14.93 s: Owings reaches home plate (already out)

This play is almost directly behind second base and there is a convenient sequence of 25 light and dark diamonds, again created by groundskeeping. Crawford is in the middle of the ninth diamond, counting from the edge of the skinned infield, at 155 feet—the skinned infield is a partial circle with a 95-foot radius centered on the pitching rubber—to the edge of the 16-foot warning track in deep center, at 391 feet. That gives us our final figure of 235 feet (again, ±10 feet).

On this play, Crawford took 0.73 seconds to throw the relay, which traveled 235 feet in 2.13 seconds, for an average speed of about 110 feet per second, almost exactly 75 mph. Posey then needed an additional 0.47 seconds to tag Owings. When Posey fielded the ball, Owings was about 13 feet from home plate (that's the radius of the circle surrounding home plate), and he applied the tag when Owings was about 3 feet from home plate.

It's worth noting that a thrown baseball loses a lot of velocity in the air, about 15 percent per second at typical speeds. Crawford probably threw the ball at around 90 mph, and it slowed down to around 60 mph by the time it reached Posey.

There is also a play from September 7, 2013, in the top of the eighth inning of a game in San Francisco between the Giants and Diamondbacks, where Crawford relays a throw from center fielder Ángel Pagán. It's difficult to determine Crawford's distance from home plate; I estimate that he's 195 feet away. The throw covers 1.77 seconds in the air, which is consistent with an average speed of 75 mph, but because of the uncertainty in the distance, it's not my primary comparison.

Additionally, in the second inning of this Game 7, Crawford threw a relay to home plate from right fielder Hunter Pence. Again, it's hard to tell just where Crawford is, but I estimate he's 50 feet past the skinned infield, or 205 feet from home plate, and the throw took 1.90 seconds to get there, an average speed of about 74 mph. The throw was not in time to catch Billy Butler scoring the Royals' first run, but Butler was already halfway from third base to home plate when Crawford made his throw.

Later, in the fourth inning, Crawford made a snap throw to first to complete a sparkling double play started by second baseman Joe Panik, who made a catch diving to his right and glove flipped the ball directly to Crawford. That throw was made under different circumstances, but Crawford's performance was similar: As this MLB Statcast video indicates, he needed 0.77 seconds to throw the relay, which he did at 72 mph, though he was forced to throw it flat-footed.

Reconstructing the Sequence

With all this in mind, let's run through the play again, annotated this time with the sequence and commentary (click to enlarge):

  1. At 0.00 seconds, Gordon hits the ball to left center (blue dashed line). The ball is hit near the end of the bat, which causes it to tail away toward left field; see the path above. Blanco initially thinks he can catch the ball on the fly, and he charges forward. Pérez also thinks Blanco will catch the ball and starts jogging toward the infield; Posey similarly jogs to the mound, anticipating a celebration involving the notorious Posey Hug.
  2. By the time the ball hits the ground at 2.97 seconds, Blanco has realized that he can't catch up to the ball, but it's too late for him to pull up to play it on the bounce. It squirts right by him toward the fence. This counters the notion that by running hard out of the gate, Gordon would risk being caught between first and second; he would never get to first base within 2.97 seconds. Pérez has to turn around and sprint toward the ball, and Blanco pulls up as he realizes he can't get there any quicker than Pérez.
  3. At 4.00 seconds, the ball bounces a second time. Had Blanco played the ball safely, he would have caught it at about 3.90 seconds. He would have been about 210 feet from second base and would have gotten the ball back well in time to keep Gordon from advancing past first base. In reality, the ball continues bouncing toward the wall, Pérez in hot pursuit.
  4. Meanwhile, Gordon has run toward first base, but not at top speed. At 4.73 seconds, he reaches first base, having seen the ball bounce once and then twice. At this point, Gordon knows he'll get to at least second and has a good chance at third. Posey returns to the plate for a potential play, and Bumgarner retreats toward the backstop to back him up. Crawford began the play at the edge of the skinned infield, but now runs out to short left field to act as the primary relay. Panik sets up about 40 feet behind him as the secondary cutoff.
  5. At 6.63 seconds, the ball reaches the fence. Pérez gets there shortly thereafter, but at 7.80 seconds, he boots the ball about 10 feet leftward along the fence. However, even if he fields it cleanly, he is over 300 feet from third base. It would take a phenomenal throw to nail Gordon there, even with Crawford relaying. Blanco's misplay is almost solely responsible for Gordon advancing, and indeed the official scorer assigned an error only to Blanco, not Pérez.
  6. At 8.43 seconds, Gordon reaches second base. He stumbles slightly as he rounds the bag, but regains his balance. He turns his head to the outfield to try to gauge the play, but it turns out he can't see it clearly because of glare from the outfield display.
  7. At 10.17 seconds, Pérez has finally secured the ball and throws it (orange dashed line) to the cutoff man Crawford, who stands 212 feet from home plate. Panik is behind him, keeping an eye on the play in left field as well as Gordon's progress on the basepath. Meanwhile, Jirschele starts raising his hands, and at 11.17 seconds (give or take), the stop sign is up.
  8. At 11.77 seconds, Crawford fields the throw, having had to "pick" it on the short hop. Normally, the cutoff man is supposed to avoid trying to catch a throw on the short hop; he should let it go to the secondary cutoff man to avoid the ball bouncing away and letting the run score uncontested. Crawford later said, "Nothing against Panik, who was the second cutoff man on the play, but I was going to catch the ball unless I couldn't catch it [that is, literally couldn't reach it]." Panik puts his hands up to forestall an immediate throw home.
  9. At 12.17 seconds, Gordon pulls in at third base. Crawford has turned around, poised to throw home, but after seeing Panik's signal and checking that Gordon isn't going, he tosses a more routine 140-foot throw at 13.53 seconds to Belt, who catches it at 14.93 seconds. The umpires call time.

So much for what actually happened. It's time to speculate! Suppose that Crawford again takes 0.73 seconds to turn around his relay throw, which we'll suppose averages 75 mph. (At 212 feet, this throw is somewhat shorter than our comparison, but it's close enough that the difference is probably minor. If anything, however, this approximation overestimates the time elapsed by the throw.) He would then make that throw to the plate at 12.50 seconds, and it would be fielded by Posey 1.92 seconds later, at 14.42 seconds.

Would that be in time to catch Gordon? He actually got into third base at 12.17 seconds. Let's suppose he could have gotten home in another 3.50 seconds, landing him there at 15.67 seconds. He would be more than 30 feet from home plate as the ball reaches Posey's glove. That gives Posey more than a second to apply the tag; in the play on Owings, Posey needed less than half a second to apply the tag.

The What-If Scenario

But suppose that Jirschele hadn't put on the stop sign, and encouraged Gordon to run all the way home. It remains to be seen whether that would be a good idea, but suppose he did that. Let's also assume that Gordon ran flat out all the way and didn't stumble going around second. Gordon would then have reached third earlier, but how much earlier?

On a triple the previous season, on April 5, 2013, in which Gordon seems to have run hard the whole way, he slid into third base 11.90 seconds after the crack of the bat. (AZ Central ran an article on this play, and somehow measured the run at 11.03 seconds. Again, I'll stick with 11.90 seconds to keep the methodology consistent.) If he ran the same way in Game 7, his time to home plate would be longer, by about the time on one of his intermediate legs (first to second, or second to third). As far as I can tell, Gordon is rarely better than 3.60 seconds on any of these—his intermediate first-to-second leg in Game 7 was 3.70 seconds—but again, let's say it adds 3.50 seconds. That gets him to home plate at 15.40 seconds, and still gives Posey nearly a full second to apply the tag. Gordon would be about 25 feet from home plate when Posey fielded Crawford's throw.

All in all, it seems as though Posey would tag Gordon comfortably out in almost any circumstance—barring an error. So how often does Crawford uncork a wild throw? In 2014, Crawford committed 21 errors, on 634 opportunities, which included 185 putouts and 428 assists (throws that lead to a putout). It's unlikely that all 21 errors were throwing errors, and also unlikely that he only threw 428 times, but let's assume both of those are true to put an upper bound on his error rate. In that case, he would have 21 errors on 449 throws, for an error rate of 0.047, a bit under 5 percent. You'd never send a runner if you thought his chances of making it were under 5 percent.

Of course, most of those throws were from shortstop to first base, a throw that averages about 120 feet. The throw in this case was 80 percent further, certainly well within Crawford's range, but probably it increases his error rate. Let's say it doubles it, to 10 percent. Is that high enough to send Gordon?

Probably not. Statistically, for the 2010–2015 era, with a runner on third base and two outs, that runner scores about 26 percent of the time. That itself should be enough to settle the matter, but there's more. In that situation, the team scores an additional run (or more) about 7 percent of the time; otherwise, in this case, the game goes to extra innings and it's a coin flip as to who wins. Maybe the home team has an edge, but it's small. Rob Mains's study in Baseball Prospectus suggested it was about 52–48 to the home team (less than it is in regulation, interestingly).

That means that with Gordon stopping at third, the Royals have about a 17 percent chance of eventually winning the game (a win in nine innings with 7 percent probability, and a win in extras with 0.52 times 0.19, or 10 percent). If he goes home and makes it, the Royals have about a 55 percent chance of eventually winning the game (a win in nine innings with 7 percent probability, and a win in extras with 0.52 times 0.93, or 48 percent). If he goes home and is tagged out, of course, the Royals simply lose.

So in order for it to be worth it to send Gordon, he has to have a success rate of at least 17/55 or 31 percent. Incidentally, Nate Silver did only this part of the analysis, arriving at a figure of 30 percent using slightly older scoring statistics. (He then simply assumed that Gordon would score more often than that and therefore advocated sending him. Very lazy, Nate!) David Freed, writing for the Harvard Sports Analytics Collective, determined a threshold of 29.6 percent based on more specific statistics (though they use the dramatic underestimate that Crawford stands 140 feet from home plate for the rest of their analysis). So there's general agreement on that roughly 30 percent figure.

I don't see Gordon scoring with anything like that probability. Maybe the long throw increases Crawford's error rate a bit more than double, maybe that 30 percent can be edged a little downward because Salvy was hit by a pitch earlier in the game, but I just don't think those two lines cross. Crawford was no playoff newbie in 2014, and sending Gordon just to force him to make a play isn't the percentage call. I'm sympathetic to those who wanted Gordon to be sent home for the excitement value, but it should be recognized for what it is: a gut reaction call that goes against both traditional baseball judgment and post-mortem analysis.

Thursday Morning Third-Base Coaching

Afterwards, there were a lot of fans who insisted that not only should Gordon have been sent home, but that people who agreed with holding Gordon were flat out wrong. Frankly, I think that's a little crazy. It comes from thinking that because Salvy did in fact pop out, he was destined to pop out. Even having been hit by a pitch back in the second inning, Salvy had a chance of walking it off against Bumgarner. He had hit a homer back in Game 1, accounting for the Royals' only run against Bumgarner. And there's the history of Kirk Gibson hitting a home run off the great Dennis Eckersley in Game 1 of the 1988 World Series. Does anyone watching that video think that either of Gibson's legs was in better shape than Salvy's? Salvy would go on to earn the 2015 World Series MVP when the Royals came right back to win the title.

Other fans thought that Bumgarner's admittedly dominant performance argued for a more aggressive stance on sending Gordon home. But again, this smacks of after-the-fact destiny. Bumgarner had already thrown 62 pitches (before facing Salvy), after throwing 117 pitches in Game 5 just three nights earlier. It was by no means a foregone conclusion that he was unhittable. Certainly Yost thought they would get to Bumgarner.

Tim Kurkjian wrote the ESPN article that analyzed the video for timings. That same article also collected quotes and observations from many of the principals involved. To a man, they all agreed that the right call was made. Most of those interviewed thought it wasn't close. (Yost thought Gordon would have been out by 40 feet, which I think is a bit of an overestimate.) The only player who was even halfway wondering what would have happened was Gordon himself, and by his own admission, he couldn't clearly see what was going on in the play at the time, because the bright display in center field cast a glare that obscured Blanco's and Perez's hijinks.

Some other observations out of that article: Jirschele claimed that he was waiting for Crawford to field the throw from Pérez cleanly before holding Gordon up. But Jirschele began holding his hands up over a second before the ball had gotten to Crawford. I suspect he felt Crawford's chances of fielding the throw cleanly were too high not to put the stop sign up before it was too late; if so, his intuition was vindicated.

Gordon recalls running hard out of the box. It didn't seem that way to most observers, including Jirschele, and in fact some fans thought he was just jogging to first until the ball dropped. The 4.73 second time to first base suggests that he was moving faster than that, but not running all out. The explanation is pretty straightforward—Gordon clearly thought that he could expect no more than a single and ran accordingly—but the charge that under the circumstances he should have been running harder than he did is a reasonable one. As we've seen, though, even his fastest run would have had a hard time beating a halfway accurate throw home.

During the following offseason, a local college baseball team reenacted the play and nailed the runner five times out of six, failing only the first attempt on an overthrow. Some fans pointed to that one failure as an additional point in favor of sending Gordon, but that first reenactment got the timing wrong; the shortstop didn't throw until the runner was nearly a full second past third base. (This video is encoded at 24 frames per second.) Seeing the runner that far ahead may have caused the shortstop to rush the throw; also, with that extra time, the catcher could plausibly have retreated to catch the ball properly and race back to tag the runner. This experiment differed too much from the original game conditions to be of much probative value, though.

Finally, five years after the game, Jirschele revisited the call, affirming that he made the right call, and capping it all with an amusing anecdote. But the plain fact of the matter is that if he had sent Gordon home, there would very likely be no debate, and instead Jirschele would be held up as the Royals' third base coach who made the call that ended his team's season.

Thursday, October 18, 2018

Mookie Betts's Glove Was in the Field of Play

I got the tl;dr out of the way in the title.

I've written previously about the value of multiple points of view (literal points of view in this case, but I think it's valuable for figurative points of view, too).  Last night, in Game 4 between the Boston Red Sox and the Houston Astros, was another example.

Here's the situation as it was in Houston (the location is kind of interesting, though not really important to the ruling).  It's the bottom of the first, and the Astros are already down 2–0, but they have George Springer on first after a one-out single, and Jose Altuve up to bat.  Altuve hits a deep fly to right, and Red Sox right fielder Mookie Betts reaches up and seems about to make the play, when his glove is closed shut by a fan's hand.  The ball bounces back into right field, where Betts retrieves it and fires it back into the infield.  Altuve ends up on second, and Springer (who presumably had to wait to see if Betts made the catch) stands on third.

Umpire Joe West initially calls a home run, and then appears to indicate interference (as shown here at the 8:48 mark).  The umpires collectively go to the replay, and after a delay of a few minutes, they call Altuve out, and order Springer to return to first.  After Marwin González is hit by a pitch, Yuli Gurriel flies out more conventionally to right and the Red Sox escape without further damage.

In the aftermath of the Red Sox' 8–6 victory, however, there was considerable controversy over whether the interference call was the right one.  The ruling was that because Betts's glove did not exit the field of play—that is, it did not cross the imaginary plane of the outfield fence—he was interfered with.  Had the glove been beyond the fence, then any contact with the fans would not have been considered interference.

The problem is that it's far from obvious where Betts's glove was at the moment of contact.  The Red Sox observed (as did some others) that Betts's body had yet to reach the fence, but the Astros pointed out that Betts was reaching backward for the ball.  Both sides agreed that the ball would have gone into the stands were it not for Betts, and both sides agreed that Betts had a good chance of catching the ball.  (I've seen a few fans claiming that Betts simply closed his glove early, but neither I nor any professional commentator seems to find that credible. See here at the 0:45 mark for a pretty clear video of Betts's glove being closed by a fan's hand.)

Incidentally, whether Betts would have caught the ball doesn't have any bearing on the correct call. West's call was predicated only on whether the fans interfered with Betts's fielding in the field of play. The approved ruling associated with Rule 6.01(e) reads:

If spectator interference clearly prevents a fielder from catching a fly ball, the umpire shall call the batter out.

The comment on that rule goes on to clarify:

No interference shall be allowed when a fielder reaches over a fence, railing, rope or into a stand to catch a ball. He does so at his own risk. However, should a spectator reach out on the playing field side of such fence, railing or rope, and plainly prevent the fielder from catching the ball, then the batsman should be called out for the spectator’s interference.

That's what made the correct interpretation of the replays so vital.

Nevertheless, both sides also thought the replays confirmed their conclusion, each perhaps pretending to a greater certainty than they really felt.  They're really not that conclusive either way, at first glance, and it was important, probably, that the call on the field was interference.  Here's a shot from one angle, for instance (the left-field camera, I think):


Can you tell where Betts's glove is in relation to the fence?  I can't.

Well, we don't have to tell from that shot alone.  Here's a second shot from another angle (maybe the first-base camera):


Hmm, it's not obvious from that shot either.

Once again, though, we don't have to rely on either shot in isolation; fortunately, the two images together will tell us what we need to know.  Both shots show the play a split-second after the fan had made contact with the glove, and with the ball just about to strike the outside of the glove.  The fans are still looking up because they're not trained to follow the ball into the glove, and because that baseball is moving fast, but that white blur is the ball in both photos.

How does this help us?  Well, let's take a look at where the glove is in relation to the wall.   Here are the same two shots, but with the same location marked on the outfield wall padding:


Notice where the glove is in relation to that mark in the two images.  It's to the right of that mark from the point of view of the left-field camera, but it's just about in line with the mark (or maybe a little to the left) from the point of view of the first-base camera.  It's simple triangulation: If the glove is directly above the fence, then it should be in the same position with respect to the mark from both views.  If it's in front of the fence, it should appear further to the right in the first view (from left field), and if it's beyond the fence, it should appear further to the left in the first view.

Since it's further to the right in the first view, the glove must have been in front of the fence at that moment, and the interference call is the right one.  (I was mildly surprised to discover this, by the way.  If I had to guess, I would have guessed that the glove was beyond the fence—but I would have been pretty loathe to guess.)  Without knowing more about the location of the cameras relative to the wall, we can't be sure how much in front it was, but at any rate, the contact was made in the field of play.


ETA: Here's a third, intermediate view—from the third base camera, I think—further confirming the findings:

Monday, November 28, 2016

Rating the Droughts

Although I live in California, this actually has nothing to do with rainfall.

Earlier this month, the Chicago Cubs ended a century-long drought—that is to say, they hadn't won the World Series since 1908, a span of 108 years.  (I suppose it's really 107 years without a title, since there's a span of a year even between consecutive titles.)  In so doing, they defeated a team that has now gone 68 years without a title, the Cleveland Indians.  The combined droughts of those two teams was a large part of what made the 2016 World Series matchup so compelling (not to mention the twists and turns of Game 7, one of the all-time great baseball games in history).

Joining them in Major League Baseball's version of the Final Four were the Los Angeles Dodgers and the Toronto Blue Jays.  The Dodgers have now gone 28 years without winning the title, and the Blue Jays have gone 23 years.  Those seem like long-ish times, although obviously nothing like the waits the Cubs endured and the Indians continue to endure.

Consider, though, that there are currently 30 teams in MLB, and if they each had an equal chance of winning each year (which they obviously don't), you'd expect each one to win one out of every 30, which also means that the expected wait between titles, for any given team, is 30 years.  So, by that measure, the Dodgers and Blue Jays haven't yet waited as long as they should expect to, the Indians have waited over twice as long as they should have, and the Cubs waited about three-and-a-half times as long as they should have.


But wait!  That assumes that there have always been 30 teams in MLB, which there certainly hasn't.  The major leagues started out with just 16 teams in 1901, which is when modern baseball is reckoned to have started: eight in the National League, and eight in the American League.  There were 16 teams still when the Cubs last won in 1908, and also when the Indians last won in 1948.  In those days, teams should have won the title every 16 years, on average, not every 30.  When assessing the severity of title droughts, years in the early days of baseball should count for nearly twice as much as they do now.

We can reflect that insight by adding title expectations per year, rather than years.  Presently, for instance, each team can expect to win 1/30 of a title each year.  Of course, that's on average.  What happens in reality, of course, is that 1/30 of the teams win one title, and the other 29/30 of the teams win no title.  But the magic of mathematics is that by adding the average, you get a measure of how long you've waited for a title, compared to how long you should wait.  In the early years, you would have added 1/16 of a title, and in intermediate years, the value would also be intermediate—more than 1/30, but less than 1/16.

To make things a bit more manageable, let's narrow our focus to those teams that haven't won in the last 50 years (and to give a basis for comparison, we'll depict the situation as it was this fall, before the Cubs won):

Chicago Cubs: No titles in 1909–
Cleveland Indians: No titles in 1949–
Texas Rangers: No titles in 1961–
Houston Astros: No titles in 1962–

Now, let's take a look at the expansion history of baseball, setting aside situations where teams just moved from one town to another:

1901–1960: 16 teams
1961: 18 teams (American League added two teams)
1962–1968: 20 teams (National League added two teams)
1969–1976: 24 teams (Both leagues added two teams)
1977–1992: 26 teams (American League added two teams)
1993–1997: 28 teams (National League added two teams)
1998–2012: 30 teams (Both leagues added one team, but the Milwaukee Brewers moved from AL to NL)
2013–present: No change in total team count, but the Astros moved from NL to AL

Thus, the Astros have played seven years with title expectations of 1/20, eight years with title expectations of 1/24, 16 years with title expectations of 1/26, five years with title expectations of 1/28, and 18 years (remember, we're looking at the situation before the Cubs won) with title expectations of 1/30.  Add those all up and you get about 2.08; the Astros have waited more than twice as long as they should have.  We might call this the waiting factor.

The Rangers are almost in the same boat, but they played a single extra year with a title expectation of 1/18, so their waiting factor is just a little bit higher, at about 2.13.  The Indians have played 12 more years without a title than the Rangers, all with a title expectation of 1/16, so their waiting factor is 2.88.

And the Cubs, those grand old lovable losers, had, as of this October, played an extra 40 years, all with title expectations of 1/16, so their waiting factor was a whopping 5.38.  They had waited, effectively, nearly twice as long as the Indians have, and compared to the average team, over five times as long as they should have.  To put it another way, if you had substituted a merely average team for the Chicago Cubs back in 1908, those alternate-universe Chicagoans would have won an extra five or so World Series.  By comparison, the Yankees won all 27 of their World Series during that time.

Holy cow indeed!

Actually, it's just a little more complicated than that, even, since (as you can tell from the brief expansion history above) the two leagues have on occasion had different numbers of teams.  The World Series always pits one National League team against one American League team, and if the National League had 12 teams that year, the chances of any given National League team winning should be 1/24, no matter how many American League teams there were.  If we take that into account, the numbers change ever so slightly:

Astros waiting factor = 2.10
Rangers waiting factor = 2.12
Indians waiting factor = 2.87
Cubs waiting factor = 5.41

For the Cubs, of course, their waiting factor has reset.  For everyone else, the wait continues.

Monday, January 5, 2015

Little's Result and the Baseball Hall of Fame


Today, in purely descriptive blog post titles...

Baseball Hall of Fame voters have been getting in their annual opportunity to gnash their teeth and/or practice their sanctimony, as a result of drugs that were first banned by the sport barely a decade ago.  It's become a thing, by which I mean that it is now possible to get all "meta" about it and write not only about the Hall of Fame itself, but also about the tooth-gnashing and sanctimony-practicing that goes on around the Hall of Fame.
Here is my "meta"; here are my two big thoughts about the Hall of Fame.

I have a principle about PEDs and the Hall of Fame that is conceptually simple but practically challenging. And that is, how do I think the player would have performed if he didn’t take PEDs? If I’m certain he didn’t take PEDs, then he would have performed as he actually did. If I’m certain he did take them, then I have to correct for how he would have performed without them. If I think there’s a chance he took them (but a chance he didn’t), there’s a correspondingly smaller correction.

With that in mind, I don’t think there’s a chance in hell (or anywhere, really) that, let's say, Barry Bonds isn’t a Hall of Famer. Even without PEDs, I feel confident that he’s a top-20 player. He might be better than that, but I don’t need to know that. That’s enough to put him in the Hall of Fame with room to spare.

Other decisions are harder than that, of course. But the most damning thing about the "no PEDs in the Hall of Fame" rule of thumb is the same thing that damns so-called "zero-tolerance rules": it relieves us of our need to make judgment calls. To think. If we deny ourselves of that, why even have human voters? Why not just set a machine to the task and leave it at that? And my answer to that is, because we want and crave human approval. Well, I don’t know about anyone else (that’s a lie), but I’d like my approval to come from humans who at least exercise a bit of thought and reason in the matter.

Here’s another thing, which just got called to my attention: the ten-year limit on player eligibility. When I was just a wee lad in late youth, I’d wonder why it was that the player vote percentage would inch up slowly year after year until they either made it in, or were ruled ineligible after ten years. The other possibility—that they would be removed from the ballot after not getting enough votes—that made sense to me. But the other one was mystifying, at first.

In time, of course, I figured it out. Because of the other limit, on the number of players one is allowed to vote for, there’s limited space in the pipeline, so to speak. I received my training for my day job in a fairly abstruse field called queueing theory. It’s essentially the study of waiting in lines, and although it has some applicability to computer networks (which is indeed why I took the course), it’s usually the class that people try to avoid taking.

Nonetheless, there’s a result of queueing theory which is extremely important, is broadly applicable to fields way outside computer science, and which ought to be known by anyone who tries to make things more efficient. It’s called Little’s Result (or Little’s Law), and it is usually taught within the first six weeks of queueing theory. It goes as follows:

In any system, at equilibrium, the average number of things in that system equals the average rate at which things enter the system, multiplied by the average time they spend there.

That’s it. And as evidence that it’s applicable to lots of things, I’ll apply it to Hall of Fame voting. Voters can vote for ten players, but in order to make it into the Hall of Fame, players must receive 75 percent of the vote. Roughly speaking, that means that each year’s class can contain no more than about 13 players, and that assumes that all of the 13 players receive almost exactly 75 percent of the vote (13 times 0.75 = 9.75, leaving about a quarter vote for the remaining eligible players). Each player can stay eligible for ten years at most.

That means that at best, there’s room for 13 times 10 = 130 players in the pipeline. Everyone else will be squeezed out. And it also explains why player vote percentages inch up; the voters have to vote for players earlier on in the pipeline, to get them out of the system before they can vote in the more recent players. They have to vote for the younger players just enough to keep them eligible. This is defensible, by the way; if you just allowed people to vote for however many players they wanted to, you’d have no control on the overall consistency of the selection. More generous voters would have disproportionately more influence on the result than more selective ones.

That’s theory. In practice, of course, it’s lower than 130; I’d be surprised if it was as high as 100. Well, you might say, that’s OK. If a hundred players was good enough for Ted Williams’s time, it ought to be good enough for ours, right? All other things remaining equal, to be sure.

The problem is, all other things have failed to remain equal! The biggest culprit is expansion. In Williams’s day, the league contained sixteen teams. (Williams was voted in in 1966, when there were twenty teams, but he didn’t compete against players active in 1966; he competed against players active much earlier.) The number of players retiring to become eligible for the Hall of Fame was probably about a hundred a year—again, a number you can ballpark with Little’s Result.

Today’s league contains thirty teams, nearly twice the number in Williams’s day. A smaller but still not neligible factor is the increasing specialization in the league. There are more players playing a significant role on teams (especially with the pitching staff). The number of retiring players is therefore about twice was it was before, about 200. But here we are, trying to shoehorn all those extra players into the same pipeline we had back when the league was much smaller.

Little’s Result also tells us what you need to do to expand the pipeline. If you want to scale it to the size of the league, then you just need to expand the vote limit and the time limit enough to double the pipeline. You could expand the number of votes to 20. Or you could expand the time limit to 20. Or you could expand them to 12 and 15, and make up the difference by reducing the vote requirement to 70 percent. But keeping them the same artificially raises the bar for entry into the Hall of Fame, unless you think today’s league draws from a talent pool no larger than before, despite baseball’s growing internationalism and the world population boom.

I still care about the Hall of Fame, too. I’d rather care about a better product, but I’m human and can’t help myself: I’ll probably always care about the Hall of Fame.

Thursday, October 22, 2009

Something to Do With Math, Right?

In my last post, I mentioned that scoring differential has been shown to be a better predictor of future wins than even past wins are. What this referred to, specifically, is the so-called Pythagorean expectation (PE), a creation of baseball statistics guru Bill James. It's called that because of the form of the PE formula: If you let RS be runs scored by the team, and RA be runs scored against the team, then a good estimator for the winning percentage—at least in baseball—is

WP = RS2 / (RS2 + RA2)

So, for instance, if over the course of a season a team scores 800 runs, but only gives up 600, then the PE formula predicts that their winning percentage will be about 8002 / (8002 + 6002) = 0.640.

Actually, there's nothing magical about the exponent 2 in this formula; as it turns out, an exponent of 1.81 matches actual winning percentage better than 2 does. What I'd like to do in this post is say a few words (well, who are we kidding here, more than a few words) about where this exponent comes from, and an interesting correlation.

Baseball, like any sport, can be treated like a combination of strategy, tactics, and random events. The strategy and tactics represent those things that are under the control of the two teams, while the random events are things that are out of their control, such as where the baseball hits the bat, how it bounces off the grass, and so forth. Technically, as I've said before, these aren't actually random, but they happen so quickly that they're essentially random for our purposes; we can't perfectly predict how they'll go. All we can do is assign probabilities: e.g., such-and-such a player will hit it up in the air 57 percent of the time, on the ground 43 percent of the time, stuff like that.

As a result, the outcome of games aren't perfectly predictable, either; as they say, that's why they play the games. Again, we can assign probabilities—probabilities that a team scores so many runs, or gives up so many runs, or that they win or lose a particular game. The PE formula is an attempt to relate the probability distribution of runs scored and runs given up, to the probability distribution of winning and losing.

The probability distribution can only be specified mathematically, but we can get an inkling of how it works by sketching it out schematically.


In the diagram above, the horizontal axis measures runs given up, and the vertical axis measures runs scored. The diagonal dotted line represents the positions along which the two measures are equal, so if you're above that line, you win the game, and if you're below it, you lose the game.

The red blob depicts the probability distribution of runs scored and given up for a hypothetical team. Each point within the blob represents a possible game outcome. Games in the lower left are pitcher's duels, while those in the upper right are shootouts. Those in the other corners are games in which the team either blew out their opponent or were blown out themselves. Any outcome within the red blob is possible, but they're more likely to be clustered in the center of the blob, where it's a darker red. The particular way in which the games are clustered around that middle is known as the normal or Gaussian distribution. Such a distribution is predicted by something called the central limit theorem, and is also borne out by empirical studies.

From this diagram, we can estimate what the team's winning percentage is: It should be the fraction of all the red ink that shows up above the diagonal dotted line. Since the team scores, on average, a bit more than it gives up, more of the blob is above that line than below it, and their winning percentage should be somewhat above 0.500—say, 0.580, maybe. What Bill James found out was that if you compute the "red ink fraction" for a variety of different values of runs scored and runs given up, the results were essentially the same as those yielded by the formula given above.

Now, as it so happens, if you try to apply the same formula to, say, basketball, it doesn't work very well at all. Practically any team will end up with a predicted winning percentage between 0.450 and 0.550, and we know very well that isn't so: Usually there's at least one team over 0.750, and often times one over 0.800 (Cleveland did that this past season). The reason can be seen if we take a look at the corresponding "red ink" diagram for basketball.


Baseball scores runs, and basketball scores points, but the principle is the same. What isn't the same, however, is the degree of variation in the scores, relative to the total score. Basketball teams show much less variation in the number of points they score than baseball teams do. Basketball teams rarely score twice as much in one game as they do in any other; by comparison, baseball teams are occasionally shut out and occasionally score 10+ runs.

In consequence, a baseball team that scores 10 percent more runs than it gives up will still lose a fair number of games, because the variation in scores is much more than 10 percent a lot of the time. In contrast, a basketball team that scores 10 percent more points than it gives up will win a huge fraction of the time, because the variation in scoring is so much less. As you can see above, the red blob is in approximately the same place in both diagrams, but because the blob is smaller (less variation), practically all of the blob is now above the diagonal line, corresponding to a winning percentage of, oh, let's say 0.850.

This property can be addressed by using James's PE formula, but with a much higher exponent. Estimates vary as to how much higher, but the differences are relatively minor: Dean Oliver suggests using 14, whereas John Hollinger uses 16.5. Either of them will give a good prediction of the winning percentage of the applicable team.

It would be nice not to have to guess at the right exponent, though. So, since there seems to be a pretty obvious correlation between the size of the blob and the size of the exponent, I decided to investigate exactly what that correlation was. It seems likely that someone else has done it before, but a Web search didn't turn up any obvious results, so I'm sharing mine here.

To begin with, there's something else in statistics called the coefficient of variation, which basically gives in this case the size of the blob, relative to how far it is from either axis. In case you're following along on your own paper, it's defined as the ratio of the standard deviation of the distribution to the mean. So, in baseball, the c.v. is relatively large; and in basketball, it's relatively small.

What I did was to figure out, from numerical computations, what the "red ink" fraction was for various c.v.'s and scoring differentials, and to see if a formula of James's basic structure, with the right exponent, would fit those fractions. (My tool of choice was the free and open-source wxmaxima, in case you're interested.) They did, very well. In fact, I found it startling how well they fit, assuming that scoring was normally distributed. In most cases, the right exponent would fit winning percentages to within a tenth of a percent.

For instance, for a c.v. of 0.5, an exponent of 2.26 fit best. The numerical computation showed that a team that scored 20 percent more than it gave up would win 60.1 percent of the time; so did the formula. As the c.v. went down, the exponent went up, just as you would expect. The actual values:

c.v. = 0.5, exp = 2.26
c.v. = 0.3, exp = 3.78
c.v. = 0.2, exp = 5.67
c.v. = 0.1, exp = 11.7

I found these results startling: the product of c.v. and exp is almost constant, at about 1.134. (I propose calling this the Hell relation.) In other words, the right exponent is almost exactly inversely proportional to the c.v. of the scoring distribution. Therefore, we would predict that the c.v. of baseball games is 1.134/1.82, or 0.623; that of basketball would be 0.081 or 0.069, depending on whether you trust Oliver or Hollinger. I've heard that Houston Rockets GM Daryl Morey once determined an exponent of 2.34 for the NFL, which would correspond to a c.v. of 0.485.

Obviously, this is a consequence of the particular scoring model I used, but the normal distribution is broadly applicable to a lot of sports, most of which have games that are long enough to allow normalcy to show up. Given how well the basic structure of James's formula holds up, I suspect the underlying assumptions are fairly valid, although it would be interesting to see that verified.

EDIT: Here's an article from a statistics professor on just this very topic, with a rigorous derivation of the various formulae.